Dead Biomechanics Society
By Ian Randall
“Good morning class.
Please sit down.
Open your textbooks to the chapter titled: ROWING BIOMECHANICS.
I want you to rip it out.
You heard me. . . rip it all out.
I want to hear ripping!”
Everything you think you know about Power Profiles, Speed and Acceleration graphs are wrong.
Power Profiles and Force Curves
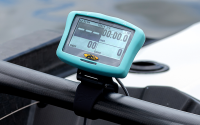
No doubt you have sat on an ergometer and watched the ephemeral pulsating graph of the Force Curve rise and fall as you row along. Have you wondered what your ideal curve should look like or what needs to change to make you faster on the water? I need to be open and honest with you – nobody has any more of a clue about Power Profiles than you. A study of leading biomechanics asked the question, after years of research what do we actually know about Force Profiles? Disturbingly they concluded, not very much! After more than 50 years of rigorous biomechanical study, we are no closer to understanding how any aspect of the Power Profile relates to on-water performance.
“Despite the significant contributions of contemporary research attempting to understand force profiles and how they affect rowing performance, there still remains a lack of clarity as to what exactly constitutes optimal propulsive force application in on-water rowing.” https://www.academia.edu/47899168/Over_50_Years_of_Researching_Force_Profiles_in_Rowing_What_Do_We_Know
It’s a comprehensive account stating that your guess is as good as any.
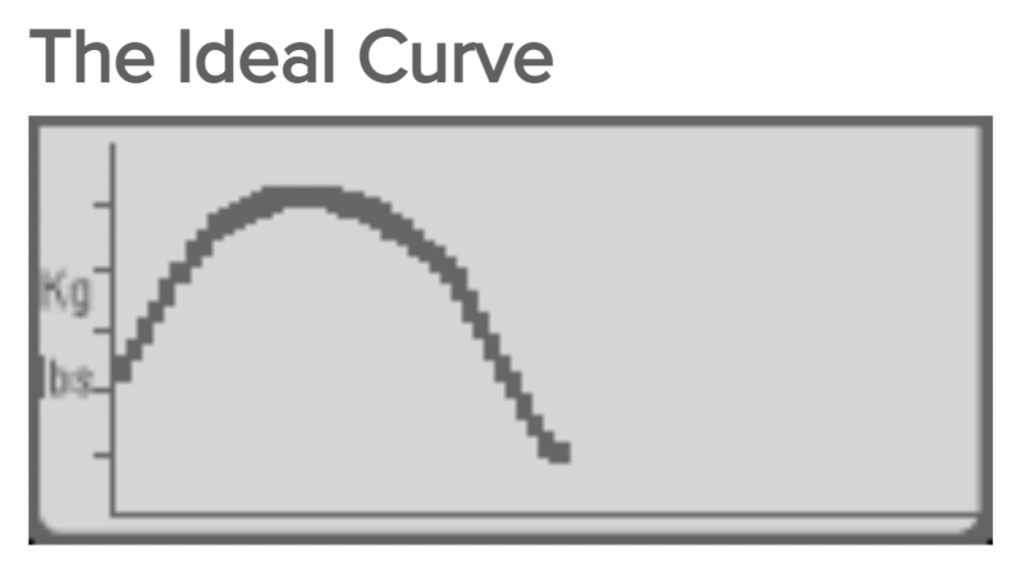
There were some key findings of the study. For starters, we can dispense with the notion that there is some form of “Ideal Curve” as your profile, like your fingerprint, is unique unto itself. We cannot look to the world’s best rowers for an archetypal profile to aspire as they all differ with no emerging patterns. On a deeper level, each rowing stroke is like a snowflake and the profile will change from one to the next. Your own Power Profile is as individual as you and no two of your strokes are identical. So forget about watching that crude low-res screen on your rowing machine as this alone makes any possible self-analysis ludicrous. When we come to on-water Force Profiles things get even more complicated as they change in relation to a host of additional factors like the boat class, sculling or sweep, seat number, stroke or bow side, male or female and athlete anthropometry (size/shape). Complexity is layered over absurdity. Many squads and clubs have squandered hard-raised funds by installing expensive power gates on boats that, through the wonders of Bluetooth technology, enable coaches to view force curves in real-time. Despite appearances, this technology won’t be able to provide any meaningful data either. Let me be clear, Force Curves and Power Profiles present us with a graphical representation of data that simply holds no relevance to the activity of rowing. They don’t tell us a thing. It would be the equivalent of getting a temperature reading from seat wheel bearings and trying to analyse rowing performance.
We are dealing with a classic case of the Street Light Fallacy which refers to the following scenario. . .
‘A policeman sees a man searching for something under a streetlight and asks what he has lost. He says he lost his keys and they both look under the streetlight together. After a few minutes, the policeman asks if he is sure he lost them here, and the man replies that he lost them in the park. The policeman asks why he is searching here, and the man replies, “this is where the light is.”‘

Intuitively, the concept of measuring pressure on the working face of the gate might appear to hold some value, but we comprehensively know that it doesn’t. If anything, the measure that could be substituted is ‘Torque’ which deals with rotational forces around an axil, the oarlock moving around the pin. Though for this to happen we’d need to create entirely new technology and I fear we have come too far to turn back now. So no, don’t waste any more time looking at power profiles and force curves – you’d be better off playing the fishing game.
Speed and Velocity
There is general confusion regarding the terms Speed and Velocity. Although in general conversation the terms are used interchangeably they have specific scientific meaning and when used correctly have questionable relevance to rowing.
There are times when it is important to know exactly how fast you are going at a particular moment in time, especially when you are coming up to a speed camera in your car. This measure of instantaneous speed is called ‘Positional Displacement.’ In rowing, at what point in the stroke cycle would you measure instantaneous speed when we have the boat and rower moving at varying positional speeds at various points of the stroke cycle? Perhaps we should consider ‘velocity’, which is the movement of an object in a given direction. Again, it is interesting to know at what point our boat’s velocity is the highest, though it may be equally relevant to know the lowest point, which doesn’t seem to interest anyone.
Boat Velocity Graph
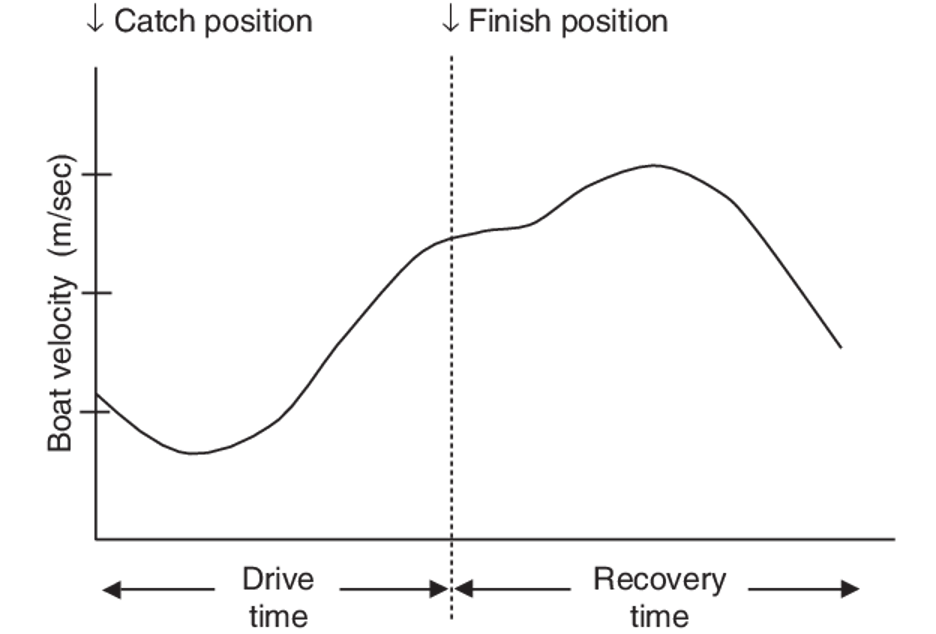
When we look at velocity graphs in rowing, they really tell us what we already know about the stroke cycle – the highest velocity is when the rower is moving on the recovery and the lowest point is at the catch. Yet this highest point is moot as the boat’s velocity is only because the rower is simply repositioning themselves in the boat. This is much like saying that you are travelling the fastest on your train commute when you are walking to the front of the carriage as it is speeding along at 65mph. From a philosophical perspective it is quite fascinating and completely counterintuitive that the highest boat velocity occurs when the rower appears to be actually moving in the opposite direction to the moving boat, but of little relevance to on-water performance. The graphical representation of velocity is only creating visual and analytical noise and can be ignored by the aspiring rower. The best measure for ‘boat speed’ is ‘Average Pace /500m’ as rowing is concerned with covering a predetermined distance in the shortest period of time.
Acceleration Graphs
Acceleration Graphs seem to be mostly ignored on the whole as they aren’t as sexy as “speed” or “power.” Yet this graph is the most important graphical representation we have! The entire point of the rowing stroke is to pick up and accelerate the slowing boat from one stroke to the next and if we do so with greater effect than our competitors, we win. If we understand the Acceleration graph we will also see one of the greatest unsolved mysteries of the rowing stroke, question one of the longest-held beliefs, and actually be able to improve your on-water performance.
The Acceleration Graph
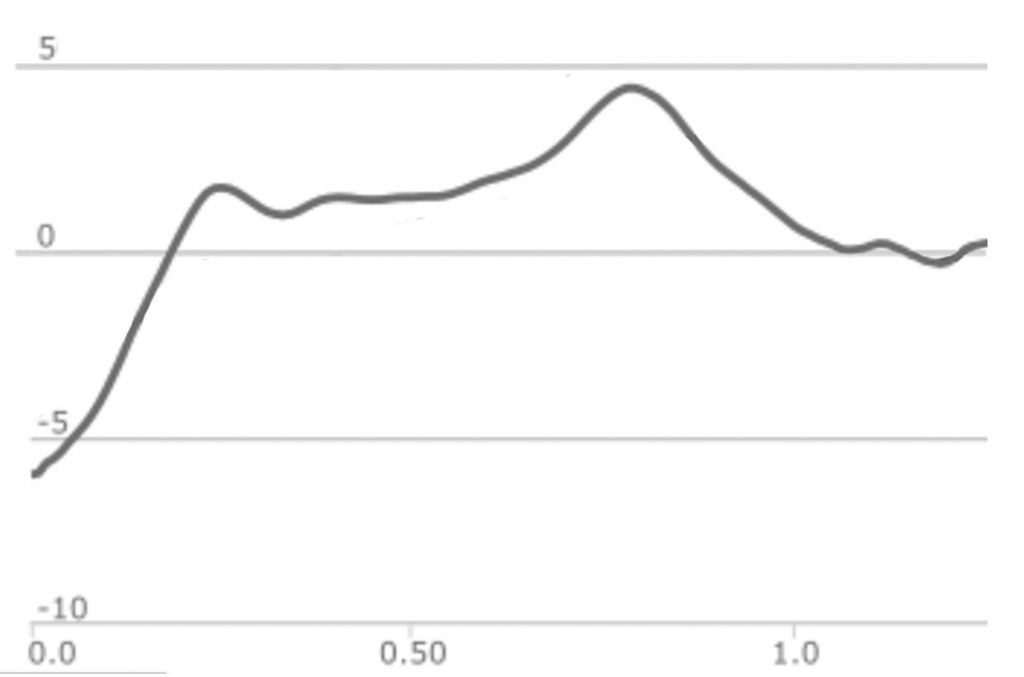
The Acceleration graph above shows the rate of change in velocity, when the boat is accelerating and when it is decelerating. The highlighted sections of the graph contained within the boxes below show when the blade is in the water and we see three acceleration phases. The Acceleration graph shows that the most critical phases of the rowing stroke are the catch and the finish as it is when the boat has the highest rates of acceleration.
Three Phases of Acceleration
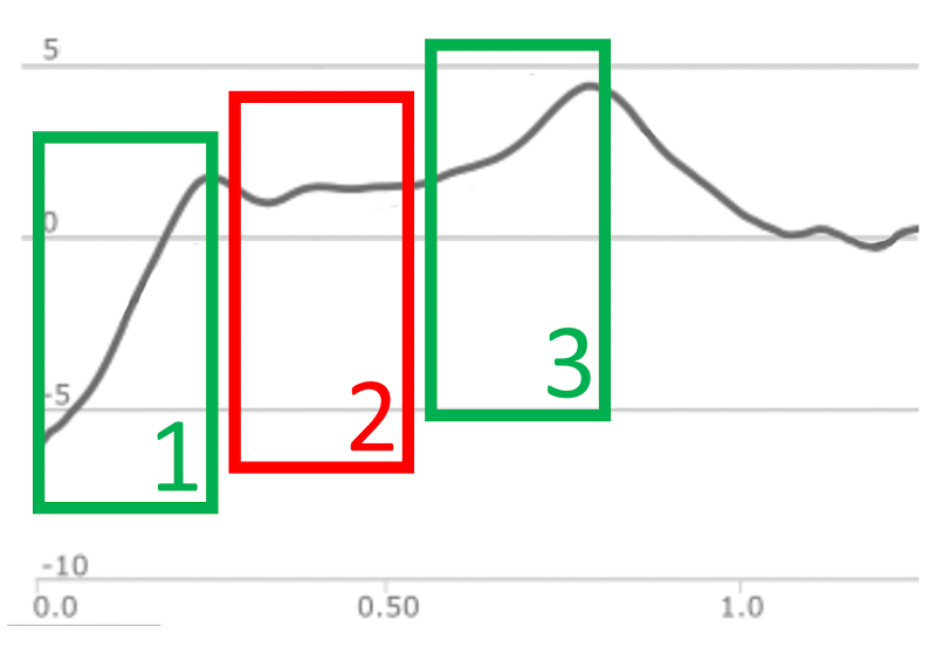
Phase 1 shows the boat accelerating from the Catch to Mid-drive as the blade is positively accelerating the boat. Phase 2 represents the mystery I was referring to and is largely an untrod theoretical area of biomechanical research. At this point of the stroke the blade is at 90-degrees or perpendicular to the boat and without explanation the rate of acceleration simply stalls. In Phase 2 the boat no longer positively accelerates and we see that the rate of acceleration just stops. The great mystery here is why do blades stall and acceleration change right when the entire biomechanical system, every muscle of the athlete, is engaged and fully committed to the stroke? The common understanding about oars is that the blade is more efficient as it approaches perpendicular to 90-degrees or Mid-drive. Yet, the acceleration graph shows that this is not true – we see that acceleration stalls when it should otherwise peak. Reversing or minimising this midstroke deceleration would give crews an incredible speed advantage. Phase 3 is from Mid-drive to the Finish as the boat moves back into positive acceleration.
As a blade designer, I have recognised the need to focus on elements that bring the most positive acceleration to the boat. Adding a hydrofoil to the top edge of a blade changes its hydrodynamics, reduces slip and increases positive acceleration of the boat which results in a higher Average Pace /500m. Acceleration data has directly shown that improving the hydrodynamics of the blade improves on-water performance. I would also say that other technologies like MK1 Magik Gates reduce the indiscriminate mechanical movements within the gate so that blades connect immediately at the catch. And of course, ensuring tight bolts on rigging and well-fitted shoes is a basic first step. It is up to rowers, coaches and manufacturers to practice evidence-based analysis, make the most of the optimal designs available to maximise boat acceleration and improve on-water performance.
Carpe Diem and good luck finding those keys.
Ian Randall is the inventor of the World Championship winning Randall Foils